2026. 1. 12. 21:48ㆍㄱㅐㅂㅏㄹ/Spring
Spring Boot 4.0.1 OpenTelemetry Integration Guide
개요 (Overview)
이 글은 Spring Boot 4.0.1 환경에서 OpenTelemetry (OTel) 를 활용하여 Observability(가시성)를 확보하기 위한 아키텍처 및 구현 가이드를 다루려고 합니다.
Spring Boot 4.0부터는 spring-boot-starter-opentelemetry가 공식 도입되어, 기존 Spring Boot 3.x에서 여러 의존성(micrometer-tracing-bridge-otel, opentelemetry-exporter-otlp 등)을 조합하던 방식이 단일 Starter 의존성으로 대폭 간소화되었습니다. 특히 4.0.1 버전에서는 OTLP 로그 내보내기(Log Export) 관련 버그가 수정되어 더욱 안정적인 통합을 지원합니다.
주요 목표
- Simplified Setup: 단일 Starter로 Tracing, Metrics, Logging 자동 구성.
- Distributed Tracing: 마이크로서비스 간 요청 흐름 시각화.
- Standardization: OTLP(OpenTelemetry Protocol) 기반의 데이터 전송 표준화.
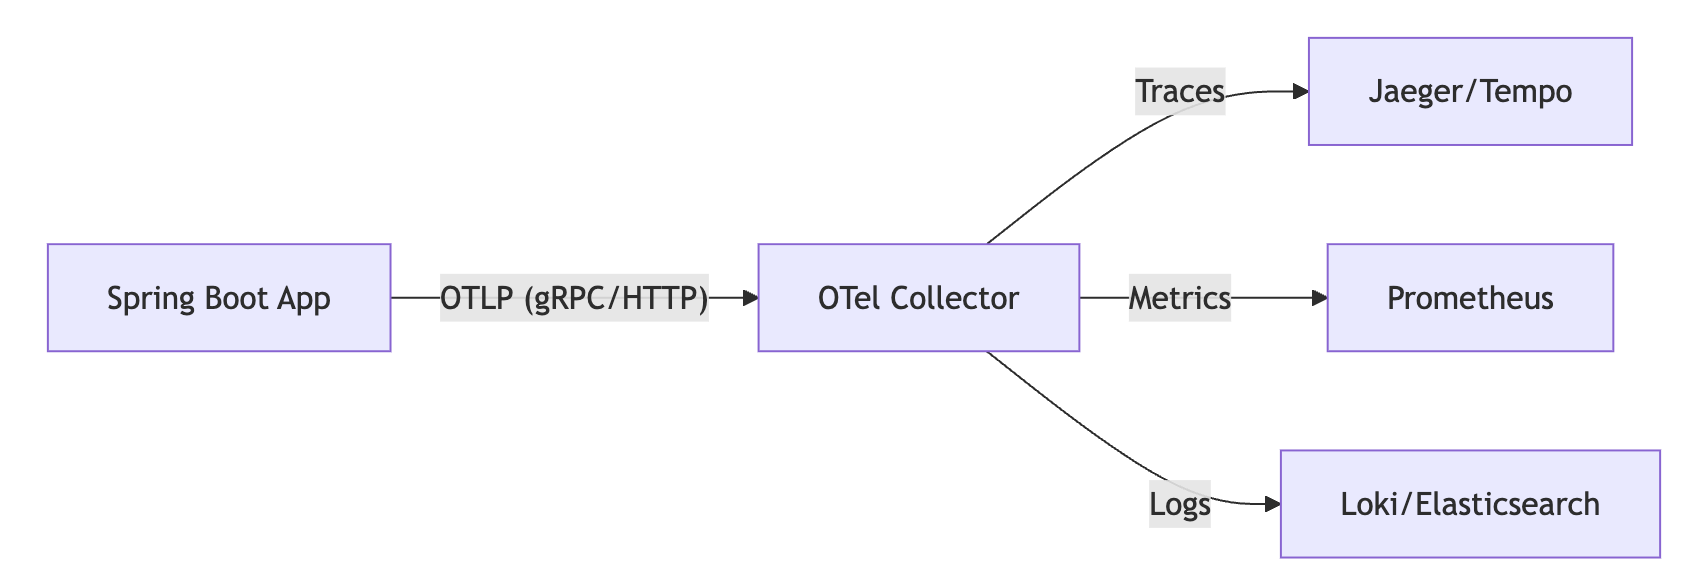
1. 아키텍처 설계 (Architecture)
프로덕션 레벨의 아키텍처는 애플리케이션이 직접 백엔드(Jaeger, Prometheus 등)로 데이터를 전송하는 것이 아니라, OpenTelemetry Collector를 경유하는 것을 권장합니다.
2. 의존성 설정 (Dependencies)
Spring Boot 4.0.1에서는 spring-boot-starter-opentelemetry 하나만 추가하면 필요한 Micrometer Tracing Bridge와 OTLP Exporter가 모두 자동으로 구성됩니다.
build.gradle
plugins {
    id 'java'
    id 'org.springframework.boot' version '4.0.1'
    id 'io.spring.dependency-management' version '1.1.7'
}

dependencies {
    // 1. Web & Actuator (Health check, Metrics endpoint)
    implementation 'org.springframework.boot:spring-boot-starter-web'
    implementation 'org.springframework.boot:spring-boot-starter-actuator'

    // 2. OpenTelemetry Official Starter (New in Spring Boot 4)
    // Tracing, Metrics, Logging via OTLP are auto-configured.
    implementation 'org.springframework.boot:spring-boot-starter-opentelemetry'

    // 3. AOP (For @NewSpan annotation support if needed)
    implementation 'org.springframework.boot:spring-boot-starter-aop'
}
3. 애플리케이션 설정 (Configuration)
Spring Boot 4에서는 management.opentelemetry.* 네임스페이스를 통해 통합 설정이 가능합니다.
application.yml
spring:
  application:
    name: payment-service

management:
  endpoints:
    web:
      exposure:
        include: health, info, metrics, prometheus

  # Spring Boot 4 OpenTelemetry Configuration
  opentelemetry:
    tracing:
      export:
        enabled: true
        # endpoint: http://localhost:4318/v1/traces (기본값)
    logging:
      export:
        enabled: true # 4.0.1에서 안정화됨
        # endpoint: http://localhost:4318/v1/logs (기본값)

  # Sampling 설정 (기존 tracing 네임스페이스 유지)
  tracing:
    sampling:
      probability: 1.0 # 개발환경 1.0, 운영환경 0.1 이하 권장
    propagation:
      type: w3c # W3C TraceContext 표준 사용

logging:
  pattern:
    # 콘솔 로그에 TraceID/SpanID 표시 (디버깅용)
    level: "%5p [${spring.application.name:},%X{traceId:-},%X{spanId:-}]"
4. 커스텀 추적 구현 (Custom Tracing)
비즈니스 로직 내부의 세부 구간을 추적하기 위한 방법은 기존과 동일하게 Micrometer Tracing API를 사용합니다.
방법 A: 어노테이션 기반 (@NewSpan)
가장 간결한 방식입니다.
import io.micrometer.tracing.annotation.NewSpan;
import io.micrometer.tracing.annotation.SpanTag;
import org.springframework.stereotype.Service;

@Service
public class PaymentService {

    @NewSpan("process-payment") // Span 이름
    public void processPayment(@SpanTag("payment.id") String paymentId) {
        // 비즈니스 로직 수행
        validate(paymentId);
    }
}
방법 B: 프로그래매틱 방식 (Tracer Bean)
io.micrometer.tracing.Tracer를 주입받아 사용합니다. (OTel API를 직접 쓰지 않고 Micrometer 파사드를 쓰는 것이 Spring Boot의 권장 사항입니다.)
import io.micrometer.tracing.Span;
import io.micrometer.tracing.Tracer;
import org.springframework.stereotype.Component;

@Component
public class ManualTracer {

    private final Tracer tracer;

    public ManualTracer(Tracer tracer) {
        this.tracer = tracer;
    }

    public void complicatedLogic() {
        Span newSpan = this.tracer.nextSpan().name("complex-calculation");

        try (Tracer.SpanInScope ws = this.tracer.withSpan(newSpan.start())) {
            newSpan.tag("calculation.type", "tax");
            doCalculations();
        } finally {
            newSpan.end();
        }
    }
}
5. 로컬 테스트 환경 (Docker Compose)
OTLP 데이터를 수신할 Collector와 백엔드 서비스를 구성합니다.
version: "3"
services:
  # 1. OpenTelemetry Collector
  otel-collector:
    image: otel/opentelemetry-collector-contrib:latest
    command: ["--config=/etc/otel-collector-config.yaml"]
    volumes:
      - ./otel-config.yaml:/etc/otel-collector-config.yaml
    ports:
      - "4317:4317" # OTLP gRPC
      - "4318:4318" # OTLP HTTP (Spring Boot Default)

  # 2. Jaeger (Tracing)
  jaeger:
    image: jaegertracing/all-in-one:latest
    ports:
      - "16686:16686"

  # 3. Prometheus (Metrics)
  prometheus:
    image: prom/prometheus:latest
    ports:
      - "9090:9090"
6. 마이그레이션 가이드 (From 3.x to 4.x)
- 의존성 삭제:
micrometer-tracing-bridge-otel,opentelemetry-exporter-otlp제거. - 의존성 추가:
spring-boot-starter-opentelemetry추가. - 프로퍼티 변경:
management.otlp.tracing.*->management.opentelemetry.tracing.export.*.
7. TraceId 이용하기
방법 1: Tracer 빈을 이용한 추출 (가장 권장)
Spring Boot가 자동 설정해준 Tracer 빈을 주입받아 현재 Span의 컨텍스트에서 직접 추출합니다.
import io.micrometer.tracing.Tracer;
import org.springframework.stereotype.Service;

@Service
public class BusinessService {

    private final Tracer tracer;

    public BusinessService(Tracer tracer) {
        this.tracer = tracer;
    }

    public String getTraceId() {
        // 현재 활성화된 Span이 없을 수 있으므로 null 체크가 필요합니다.
        if (tracer.currentSpan() != null) {
            return tracer.currentSpan().context().traceId();
        }
        return "no-trace-id";
    }
}
방법 2: MDC(Mapped Diagnostic Context)에서 추출
Micrometer Tracing은 로그 연동을 위해 자동으로 traceId를 SLF4J의 MDC에 넣어줍니다. 별도의 빈 주입 없이 빠르게 가져올 때 유용합니다.
import org.slf4j.MDC;
import org.springframework.web.bind.annotation.GetMapping;
import org.springframework.web.bind.annotation.RestController;

@RestController
public class TestController {

    @GetMapping("/trace")
    public String trace() {
        // application.yml 설정에 의해 "traceId" 키로 자동 저장됨
        return MDC.get("traceId");
    }
}
8. 결론
혹시 잘못된 내용이 있으면 댓글 부탁드립니다.
'ㄱㅐㅂㅏㄹ > Spring' 카테고리의 다른 글
| [Java/Spring] 인터페이스/추상클래스 JSON 변환이 안될 때? Jackson 다형성(Polymorphism) 완벽 해결법 (0) | 2026.01.04 |
|---|---|
| MSA가 정답은 아니잖아요? Spring Modulith로 우아한 모놀리스 만들기 (0) | 2025.12.23 |
| @DataJpaTest 할 때의 주의 사항 (0) | 2021.02.02 |
| Spring REST 에서의 Global Exception (0) | 2021.01.11 |
| Spring Cloud OpenFeign, 그리고 SSL (2) | 2020.12.29 |